This is the monthly transparency report for February 2017. OVPN had one unplanned interruption and two planned interruptions during the month of February.
Summary
Our VPN servers had an uptime of over 99.5% during February. In total, OVPN encrypted and anonymized 1848 TB, which is slightly less than last month.
During the month of February, we did not receive any requests from authorities. To date, we have never given out any customer data to a third party.
Below are the traffic and uptime statistics from our current data centers. The empty gap in the graphs was caused by the monitoring system being down for a while. No actual server downtime took place.
VPN servers in Malmö, Sweden
Traffic spikes (Mbit/s)
Analysis
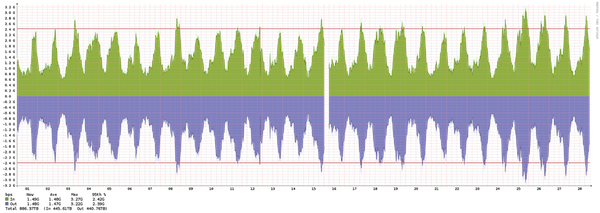
Our data center in Malmö has a maximum capacity of 10 Gbit/s. However, during the month of February, the traffic load amounted to 1480 Mbit/s on average.
The highest traffic spike was 3270 Mbit/s, which is 32.7% of the maximum capacity. The 95th percentile landed on 2420 Mbit/s, meaning the traffic load was below 24.2% of the maximum capacity 95% of the time.
In total, 445.7 TB of traffic was encrypted and anonymized by the VPN servers in Malmö.
The Malmö data center had an uptime of 99.5% during the month of February.
VPN servers in Stockholm, Sweden
Traffic spikes (Mbit/s)
Analysis
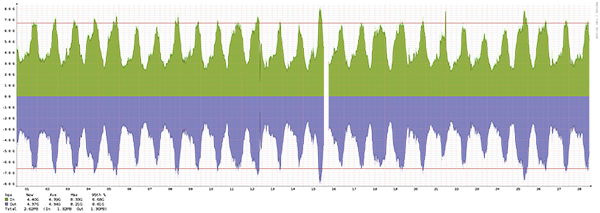
OVPN upgraded the capacity in Stockholm under October from 10Gbit/s to 20Gbit/s. During the month of February, the average traffic load was 4380 Mbit/s.
The largest traffic spike recorded was 8330 Mbit/s, which represents 41.7% of the maximum capacity. The 95th percentile landed on 6680 Mbit/s, meaning the traffic load was below 33.4% of the maximum capacity 95% of the time.
In total, 1.32 PB, meaning 1320 TB of traffic was encrypted and anonymized by the VPN servers in Stockholm.
The Stockholm data center had an uptime of 99.5% during the month of February.
VPN servers in Frankfurt, Germany
Traffic spikes (Mbit/s)
Analysis
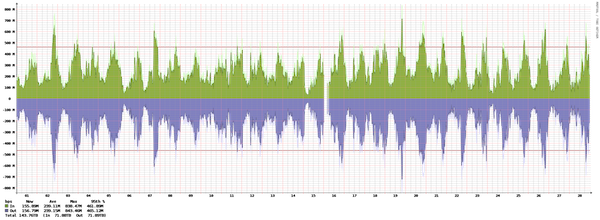
Our data center in Frankfurt has a maximum capacity of 10 Gbit/s. However, during the month of February, the traffic load amounted to 238.46 Mbit/s on average.
The largest traffic spike recorded was 838.5 Mbit/s, which represents 8.4% of the maximum capacity. The 95th percentile landed on 461.9 Mbit/s, meaning the traffic load was below 4.6% of the maximum capacity for 95% of the time.
In total, 71.6 TB of traffic was encrypted and anonymized in the Frankfurt data center.
Frankfurt had an uptime of 99.5% during February.
VPN servers in Amsterdam, Netherlands
Traffic spikes (Mbit/s)
Analysis
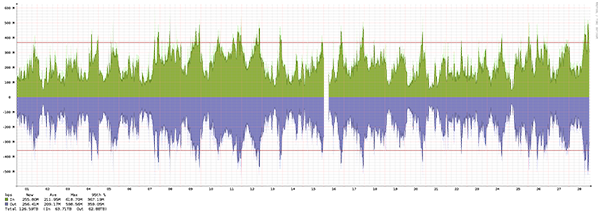
We deployed our servers in Amsterdam in December 2016, meaning February is the third month the servers have been running. The Amsterdam data center has a maximum capacity of 3 Gbit/s. However, the traffic load was only 212.4 Mbit/s on average in February.
The largest traffic spike recorded was 618.7 Mbit/s, which represents 20.6% of the maximum capacity. The 95th percentile landed on 367.2 Mbit/s, meaning the traffic load was below 12.2% of the maximum capacity for 95% of the time.
In total, 63.8 TB of traffic was encrypted and anonymized in the Amsterdam data center.
Amsterdam had an uptime of 99.5% during February.
VPN servers in Toronto, Canada
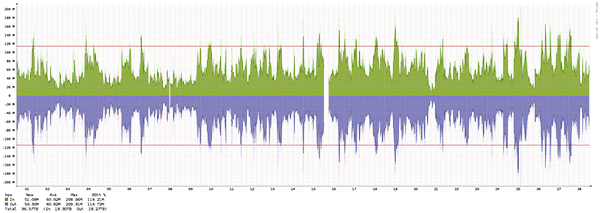
Traffic spikes (Mbit/s)
Analysis
We deployed our servers in Toronto in December 2016, meaning February is the third month the servers have been running. The Toronto data center has a maximum capacity of 3 Gbit/s. However, the traffic load was only 60.8 Mbit/s on average in February.
The largest traffic spike recorded was 209.0 Mbit/s, which represents 7.0% of the maximum capacity. The 95th percentile landed on 114.2 Mbit/s, meaning the traffic load was below 3.8% of the maximum capacity for 95% of the time.
In total, 18.3 TB of traffic was encrypted and anonymized in the Toronto data center.
Toronto had an uptime of 99.5% during February.
Website
WEB01 had an uptime of 99.99%, and an average response time of 66.42 ms in February.
Database
SQL01 had an uptime of 99.99%, and an average response time of 4.71 ms in February.
Maximilian Holm
